Cooperative Binding: Watch T-state Relax to R-state
Press Bind next O2. Each oxygen flies into a heme, the cooperative wave sweeps the tetramer, and the whole molecule slides from tense and clamped (left) toward relaxed and high-affinity (right). That allosteric switch is why the curve is sigmoid.
T-state, zero O2: all four subunits tense and clamped. Low affinity. This is hemoglobin arriving in oxygen-poor tissue.
O2-Hemoglobin Dissociation Curve
The S-shape is cooperative binding made visible. Tap each curve to see what shifts it clinically.
NormalP50 = 26 mmHg. Balance between O2 loading in lungs and unloading in tissues. This is the physiologic sweet spot.
Structure: The Hemoglobin Tetramer▼
Hemoglobin is a quaternary protein: 4 globin chains, each hugging one heme group, each heme carrying one iron (Fe2+) that grabs one O2. Total capacity: 4 O2 per molecule.
Tap a blurred cell, or use the button, to self-test the tetramer table.
Type
Subunits
Context
Curve
Hb A
2alpha + 2beta
98% adult
Normal
Hb A2
2alpha + 2delta
2% adult
Normal
Hb F
2alpha + 2gamma
Fetal / neonates
Left shift
Hb S
2alpha + 2beta(E6V)
Sickle cell
Normal P50; polymerizes when deoxy
Memory hook · tap to revealAlpha chains are present in ALL types. The beta, gamma, or delta chain is what defines each variant. Hb A = Alpha Beta = Adult.
The key board fact: myoglobin is a MONOMER (1 chain, 1 heme). It has a hyperbolic curve (not sigmoid) because it cannot do cooperative binding. Highest O2 affinity of any oxygen-binding protein. It is the muscle oxygen reserve.
Right Shift: CADET, Face Right▼
Right shift means lower O2 affinity: hemoglobin gives up oxygen more easily to tissues. P50 rises above 26 mmHg.
Memory hook · tap to revealCADET (face right for right shift): CO2 up · Acidosis (H+ up) · DPG (2,3-BPG) up · Exercise · Temperature up
The Bohr effect is the pH and CO2 piece: when CO2 rises in tissues, H+ rises, hemoglobin binds H+ and releases O2 to the tissues that are actually working. This is purposeful physiology, not a failure.
2,3-BPG is produced in RBCs during glycolysis. It stabilizes the T-state (deoxy conformation), shifting the curve right. Chronically hypoxic patients (high altitude, chronic anemia) upregulate 2,3-BPG as an adaptation to deliver more O2 despite lower Hb levels.
From the Attending
The board favorite: a patient with chronic anemia, Hgb 7, but surprisingly comfortable. The question is asking you to explain why. The answer is compensatory 2,3-BPG elevation causing a right shift. Low Hb does not always mean a sick patient: the curve adapts.
Quick self-test: list all five CADET right-shift factors before revealing.
CADET: CO2 up · Acid (H+) up · 2,3-DPG up · Exercise · Temperature up. All five stabilize the T-state (deoxy), shifting P50 to the right.
Left Shift: HbF, CO, Methemoglobin, Alkalosis▼
Left shift means higher O2 affinity: hemoglobin holds onto O2 too tightly and refuses to release it to tissues. P50 falls below 26 mmHg.
Memory hook · tap to revealFALCO: Fetal Hb · Alkalosis · Low temperature · CO poisoning · Other (methemoglobin)
Tap a blurred cell, or use the button, to self-test the left-shifters.
Agent
How it shifts left
Board tell
HbF
Gamma chains ignore 2,3-BPG; HbF stays in R-state (high affinity)
Neonate; shifts to HbA by 6 months
CO
About 200x O2 affinity; allosteric lock into R-state for remaining subunits
Cherry red skin; SpO2 falsely normal
MetHb
Fe3+ cannot bind O2; remaining Fe2+ sites are locked in high-affinity state
Cyanosis with normal PaO2; chocolate blood
Alkalosis
Low H+ reduces Bohr effect; Hb holds O2 more tightly
Hyperventilation patient, CXR normal
CO poisoning board trap: pulse oximetry reads falsely normal (it cannot tell HbO2 from HbCO). The patient is dying with a 99% saturation. Always order a co-oximeter ABG when CO poisoning is suspected, not a standard pulse ox.
Methemoglobin board trap: SpO2 is low (78 to 85%) but PaO2 on ABG is normal. Treatment: methylene blue 1 to 2 mg/kg IV. It reduces Fe3+ back to Fe2+ via the NADPH pathway. Watch for G6PD-deficient patients: methylene blue fails (they cannot generate NADPH), and exchange transfusion is required instead.
HbA vs HbF vs HbS: The Tale of Three Tetramers
Same alpha chains, three different partners. Tap a fighter to see what makes it behave.
HbA: the adult workhorse
Subunits2 alpha + 2 beta
Share of adult HbAbout 98%
P5026 mmHg (normal)
2,3-BPG bindingStrong: tunes delivery
Board hookThe reference curve everything else shifts off
HbF: the placental thief
Subunits2 alpha + 2 gamma
2,3-BPG bindingPoor: stays in R-state
CurveLeft shift, higher affinity
Why it mattersPulls O2 off maternal HbA across the placenta
Board hookReplaced by HbA by 6 months; protects newborns with HbSS
Board hookHydroxyurea raises HbF, which cannot join the polymer
The Blue Patient: A Discriminator
A patient looks dusky or the pulse ox is low. Commit to an answer at each step, then reveal the logic. CO, methemoglobin, and anemia all read differently if you know where to look.
Step 1 of 3
The pulse oximeter reads LOW, but the arterial blood gas PaO2 comes back NORMAL. What does that mismatch tell you?
Step 2 of 3
You draw blood. It is CHOCOLATE BROWN and does not turn red when shaken in air. SpO2 is stuck near 85%. Which carrier problem is this?
Step 3 of 3
Methemoglobin is confirmed and the child is symptomatic. What is the first-line antidote, and what one detail would change your plan?
O2 Content vs pO2 vs Saturation: The Triple Confusion▼
O2 content (mL O2/dL blood) = (1.34 x Hgb x SaO2) + (0.003 x PaO2)
The 0.003 term (dissolved O2) is tiny. Almost all O2 is carried by hemoglobin. This means:
Anemia: Hgb is low, O2 content is low, but PaO2 is NORMAL. This is not hypoxemia. The lungs are fine.
CO poisoning: PaO2 is normal (dissolved O2 is unaffected). SpO2 is normal (pulse ox fooled). O2 content is catastrophically low (Hb occupied by CO).
Polycythemia: Hgb is high, O2 content is high. Useful at altitude.
Board stems love to present CO poisoning with a normal pulse ox and ask why the patient is dying. The O2 content equation is the answer: it is carrying capacity, not partial pressure, that fails.
Lost in the symbols? Tap each one. Think of the blood as a bus.
Hgb · tapHemoglobin, in g/dL. The protein inside red cells that O2 actually rides on. This is the number of seats on the bus. More Hgb, more seats.
SaO2 · tapArterial oxygen saturation: the percent of those hemoglobin seats that are filled with O2. 98 percent means 98 percent of seats taken. Not the tissues, not the plasma. The seats.
PaO2 · tapPartial pressure of O2 dissolved loose in the plasma, the aisle of the bus. It shows how well the lungs are loading, but it is a tiny sliver of total O2 because almost nothing rides dissolved. That is why a normal PaO2 can sit right next to a dying patient in CO poisoning.
Carrying capacity · tapHow much O2 the blood can haul, set almost entirely by Hgb. Lose seats (anemia) or fill them with an impostor (CO) and capacity collapses even when the lungs and the PaO2 look perfect.
Polycythemia: more red cells means more Hgb means more seats, so O2 content runs high. Your read is exactly right.
Fetal Hemoglobin and the Placental Gradient▼
In the placenta, maternal and fetal blood run side by side but do not mix. Fetal hemoglobin needs to pull oxygen off maternal HbA, and a steeper left-shift is the mechanism.
HbF gamma chains bind 2,3-BPG poorly. Because 2,3-BPG normally stabilizes the T-state (reduces affinity), HbF without BPG binding stays in R-state: high affinity. Maternal HbA, which does bind BPG, has lower affinity. O2 moves from mother to fetus along this gradient.
Memory hook · tap to revealHbF = BPG-independent = always R-state = high affinity = left shift. This cannot release O2 to tissues efficiently: fine for a fetus getting O2 from mom, fatal for an adult needing tissue delivery.
Hydroxyurea induces HbF production in sickle cell patients. HbF chains cannot participate in HbS polymerization (which requires beta chains with valine at position 6). More HbF means fewer sickling events. Trade-off: bone marrow suppression (check the CBC).
Physiologic timeline: HbF peaks at birth and falls to adult levels (less than 1%) by 6 months. Neonates with sickle cell disease are asymptomatic at birth because of high HbF. Symptoms emerge as HbF wanes after 6 months: the classic dactylitis presentation.
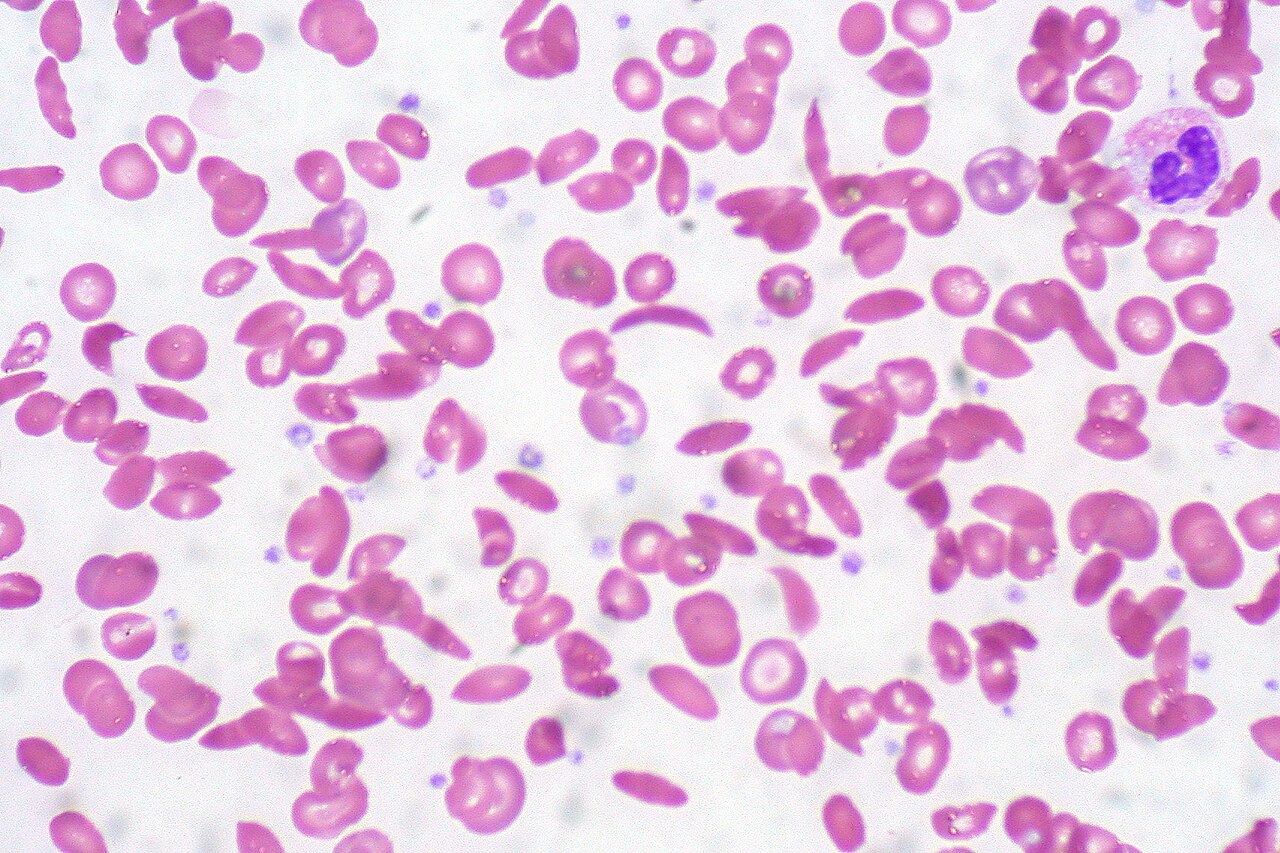
Sickle Cell Disease: Mechanism to Crisis▼
The mutation: beta-globin position 6, glutamic acid (hydrophilic) replaced by valine (hydrophobic). One hydrophobic swap ruins a career.
When O2 is present, valine is pulled toward the protein exterior by the conformational change and the RBC stays round. When O2 falls, valine sinks hydrophobically into adjacent HbS molecules, forming rigid polymers: crescent shape, vessel occlusion.
Triggers of sickling: hypoxia, acidosis, dehydration, fever, infection, cold exposure, and high altitude. The board will present one of these as the precipitant.
Tap a blurred cell, or use the button, to self-test the complications.
Complication
Underlying process
Key board fact
Dactylitis
Vaso-occlusion in hand and foot vessels
First manifestation after 6 months
Acute chest syndrome
Pulmonary vaso-occlusion plus infection
Most common cause of death
Aplastic crisis
Parvovirus B19 infects erythroid progenitors
Reticulocyte count falls to near zero
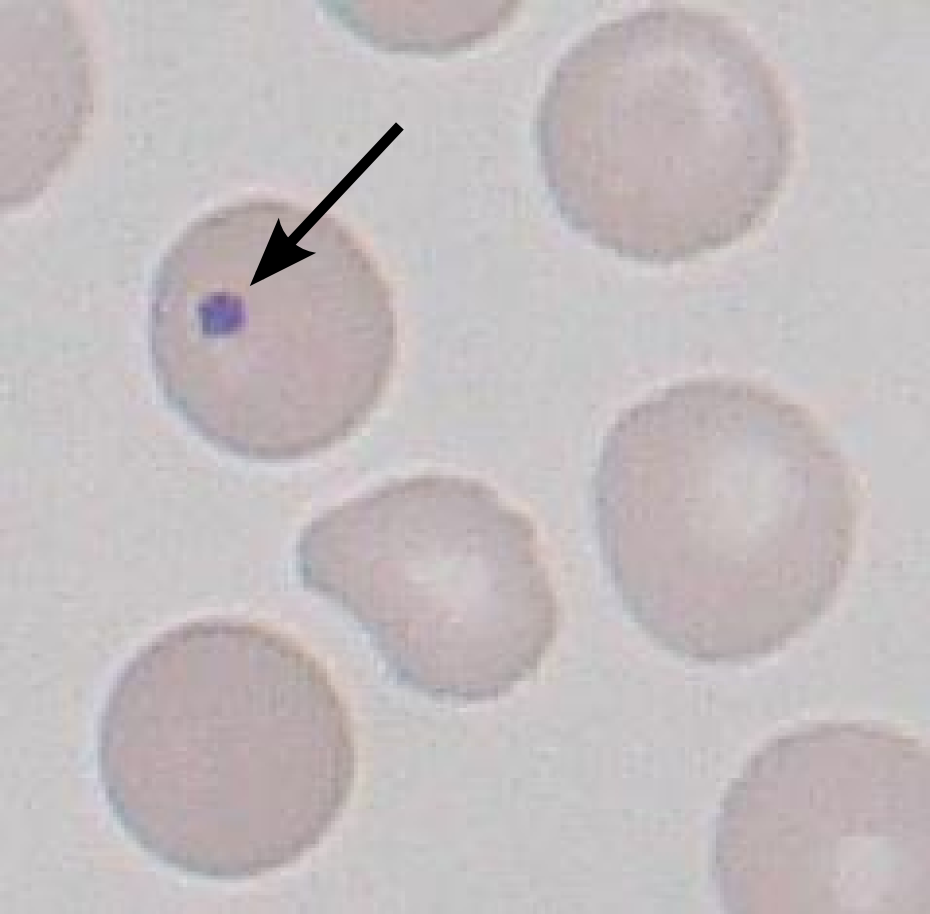
Autosplenectomy
Repeated splenic infarcts by age 6
Howell-Jolly bodies on smear
Splenic sequestration
Sudden pooling in spleen
Rapid fall in Hgb, shock
Avascular necrosis
Femoral or humeral head infarction
Hip pain with normal plain film early
Management: acute crisis gets O2, IV fluids, and analgesics (opioids for severe pain). Stroke (a cerebrovascular accident, CVA) gets exchange transfusion, not clot-busters: in sickle cell the vessel is jammed with sickled cells, not a true clot, so you swap out the sickled blood to dilute the sickle cells rather than give tPA or aspirin. Aplastic crisis gets supportive care and transfusion if severe; the Parvovirus infection is self-limited. Prophylaxis: pneumococcal, meningococcal, and Hib vaccines, plus penicillin prophylaxis through age 5.
From the Attending
Aplastic crisis: the classic board setup is a sickle cell child with fever and rash 2 to 3 weeks ago, now profoundly anemic. The rash was slapped-cheek from Parvovirus B19. The reticulocyte count is the key lab. If it is near zero, the marrow has shut down, so this is not sickling and not sequestration. Anemia plus a near-zero reticulocyte count after a slapped-cheek illness is aplastic crisis until proven otherwise.
So why give hydroxyurea to a sickle cell patient? Predict the link, then tap to reveal.
The payoff · tapHydroxyurea switches the fetal-hemoglobin gene back on. HbF runs on gamma chains, so it has no beta-6 valine and physically cannot lock into the deoxy-HbS polymer. Pack more HbF into each cell and the polymer cannot reach the size it needs to warp the membrane: fewer cells sickle, fewer crises, fewer hospital stays. Hydroxyurea is the disease-modifying drug in sickle cell because the HbF it induces cannot join the HbS polymer.
On rounds
YouI started her on hydroxyurea. Her white count was up, so it should pull that down.
AttendingThe white count. Sure. That is the side gig.
AttendingWhat is it doing to her hemoglobin?
You...it raises fetal hemoglobin.
AttendingAnd fetal hemoglobin runs on gamma chains. No beta, no valine at position six. So when her cells deoxygenate and the sickle hemoglobin tries to stack into a polymer, the HbF is the wrong shape to join the chain. It jams the line. More HbF, shorter polymers, fewer crescents.
You give hydroxyurea in sickle cell because the HbF it induces cannot enter the HbS polymer. Dropping the white count is a bonus, not the point.
Medically reviewed by Kaitlyn Cocuzzo, MD and Fatima Ali, DO
Bone Wizardry is an independent educational resource for visual learning in the medical sciences. It is not affiliated with, endorsed by, or sponsored by any licensing or examination board, contains no real or recalled examination questions, and does not guarantee any educational or examination outcome.